

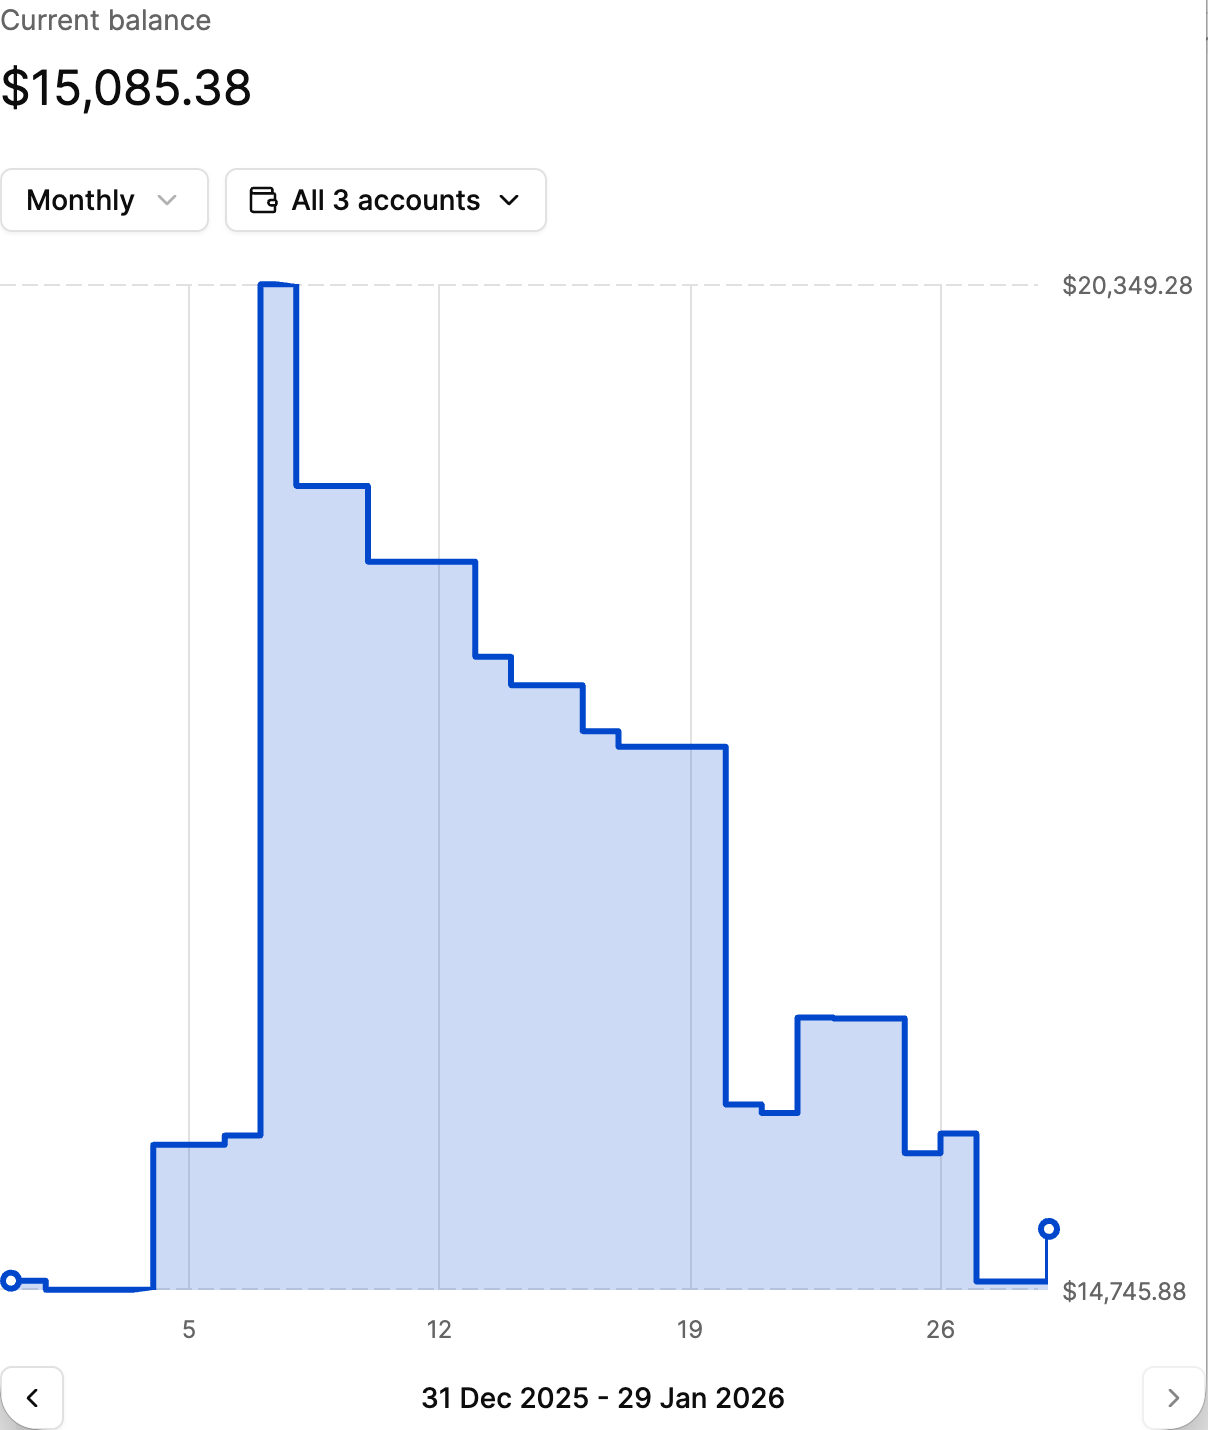
Balances Over Time Widget
The Balances Over Time graph is a widget that provides customers with dynamic, interactive graphs that visualise how account balances have changed over the last 12 months. Users can easily switch between different time periods, and between aggregated account views and single account views allowing a comprehensive visual representation of accounts at any given time.
If you're interested in displaying a balance over time to your customers but do not wish to use Bud's widget you can integrate directly with our Balances Over Time API.
This widget has the optional capability to include forecasted balances which clients can choose to configure on or off by speaking to the Bud team.
This guide will walk you through how to use and navigate the Balances Over Time graph effectively.
How it works
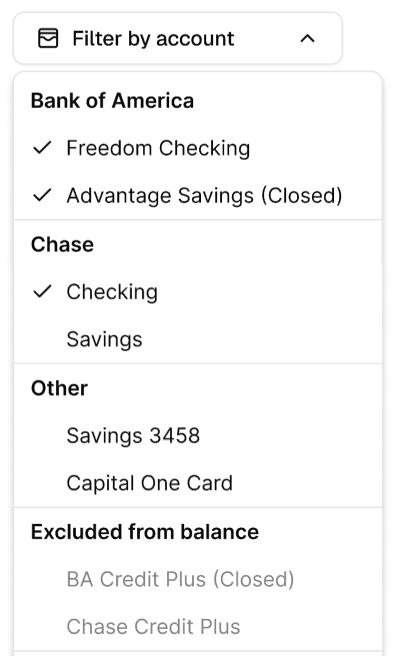
Switching between account views
Use the tabs at the top of the graph to toggle between an aggregated view (all accounts combined) and individual account views. This allows users to analyse overall financial trends or focus on specific accounts.
Excluded account types
By default the following account types will be excluded from the Balances Over Time widget, meaning your customers can't select them. If you would like to update this please reach out to your Bud account manager.
- Auto Loan
- Boat Loan
- Brokerage
- Business Loan
- Certificate of Deposit
- Credit Card
- Disability Insurance
- Health Insurance
- Home Equity Loan
- Investment
- IRA
- Liability Insurance
- Life Insurance
- Line of Credit
- Loan
- Mortgage
- Other
- Personal Loan
- Property Insurance
- Roth
- RV Loan
- Student Loan
- Travel Insurance
- Vehicle Insurance
Switching between timeframes
Use the dropdown menu to choose from the following time periods:
- Weekly
- Monthly
- Yearly
Use the arrows at the bottom of the graph to navigate to previous periods.
Interacting with the graph
The graph is fully interactive. Users can hover over or click on different points in the graph to see the balance for the selected date. The displayed balance and date will update dynamically, allowing users to see daily changes.
Customisation
The following customisations can be applied, by appending search parameters to the generated URL:
timeframe- The range of data available in the view, determining the increments the navigation back/forth can be made.
- Possible options are
week,monthandyear - For example,
https://widgets.thisisbud.com/balances-over-time?token=an-example-token&timeframe=year
Updated 2 months ago